Technical indicators can be used to help you enter and exit trades.
They assist you in predicting the future with a fair amount of accuracy, and are very instrumental in maximizing trading profits and minimizing losses.
Technical indicators are a good supplement to your use of technical analysis.
As we learned in one of the previous modules, technical analysis is the formal name for analyzing stock charts.
The basic premise is that you look at past price behavior in an attempt to determine where prices are headed in the future.
Consider it like predicting the weather. It doesn't guarantee what is "going" to happen, but it merely guides you in preparing for what is "likely" to happen.
Pretend that the price movement on the chart is the actual weather. Technical indicators would be the weather satellites that aid you in predicting the weather.
A weather satellite (technical indicator) can warn you that a storm is coming (prices are going to fall) so that you can prepare for it accordingly (protect profits or enter a new trade).
What are Technical Indicators
Technical indicators are mathematical representations of market patterns and behavior; or in my wife's terms, "it's all those squiggly lines going all over the place".
The indicators are formed by plugging information such as price and volume into a mathematical formula. The formula produces a data point. Several data points are collected over a period of time and are usually connected by a thin line.
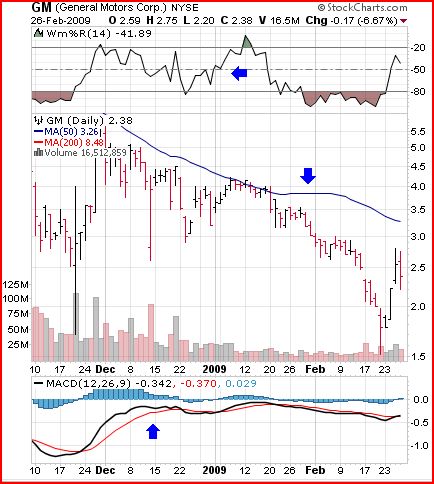
The blue arrows on the chart below point to the three technical indicators. As you look at the chart see if you can point out the 4 keys areas that we discussed in Module 4:

Technical indicators can be found above or below the chart, and others are plotted on top of prices. The indicators help to predict where future prices are going and whether or not the stock is in an overbought oroversold condition.
Overbought: A technical condition that occurs when there has been a lot of buying and the price of the stock is considered too high and susceptible to a decline.
Oversold: A technical condition that occurs when there has been a lot ofselling and the price of the stock is considered too low and a rally in prices is anticipated.
Essentially traders use technical indicators for two things:
- To generate buy and sell signals
- To confirm price movement
There are two main types of indicators: leading and lagging.
Leading Indicators
A leading indicator precedes price movement, and is often used to generate buy and sell signals. Most represent some form of price momentum over a given period of time.Leading indicators are affected more heavily by recent price changes and tend to generate more signals and allow more opportunities to trade than lagging indicators.
Since the indicators produce more buy and sell signals, they also produce more false signals.
Some of the more common leading indicators are:
- Stochastics
- Williams %R
- Relative Strength Index
When leading indicators are right, they allow you to get into a trade early and make more money, but when they're wrong you tend to lose money because you're in and out of trades more frequently.
What you think will happen doesn't actually happen. This is where lagging indicators come into play...
Lagging Indicators
A lagging indicator is a confirmation tool because it follows price movement. It happens "after the fact".
So after prices have been trending for some time the lagging indicator will then produce a signal that the trend is changing. It solidifies and is a final confirmation that indeed the trend is changing.
Two of the more common lagging indicators are:
- MACD
- Moving Averages
The Holy Grail of Technical Indicators
I don't care what technical indicator you use, price and volume will always win the day.
Think about it, technical indicators are nothing but mathematical formulas with data plugged into them. What is the primary source of data plugged into them?
That's right, price and volume.
The formulas can be manipulated, but the actual price and volume is created by real people buying and selling the stock.
At the end of the day, buyers and sellers are what control and move the market.
My technical indicator could tell me that tomorrow the stock is going up, but if tomorrow sellers rule the day and the stock falls then essentially their actions rendered my indicator useless.
Use the indicators as a supplement to your trading and to assist you in seeing price action more clearly. Do not treat them as if they are the law!
Final Thoughts
Sometimes it's not clear what is going on by merely looking at the chart and this is where a technical indicator comes into play.
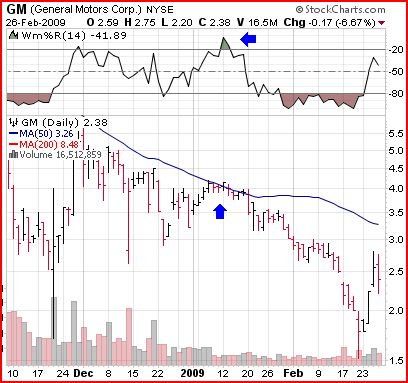
For example, the flat area on the chart below may seem insignificant, but as I look at Williams %R I can see there was heavy buying (overbought) in this area:

Remember the definition of overbought above: A technical condition that occurs when there has been a lot of buying and the price of the stock is considered too high and susceptible to a decline.
And what do you know, prices did indeed fall right after the overbought signal.
I was so hung up on oversold and overbought when I first learned how to trade. For the life of me I couldn't figure out how a lot of buying could cause a stock to fall in price.
It's so counter-intuitive.
It will take some time, but the more you learn about the stock market the more it will make sense.
Each indicator has its own unique purpose. Grouping indicators that complement each other can create a powerful winning combination.
One simple combination that I use frequently is combining a leading indicator with a lagging indicator.
You don't want two indicators on a chart that are essentially the same. For example, don't have two indicators that both measure volume.
Often I encounter traders that will have as many as 12 indicators on a chart. In my opinion this just confuses people more. This is my belief and it certainly is not the belief of all, but more is NOT better. Clean and simple wins the day for me.
The more indicators I place on a chart, the more my eyes start to spin and I get dizzy by all the zig zag lines going all over the place. Besides, it takes your attention away from what really matters…price and volume.
Lesson Review
Technical Indicators are like weather forecasting. They don't guarantee what is "going" to happen, but merely guide you in preparing for what is "likely" to happen.
There are two kinds of indicators:
- Leading (Stochastics, Williams %R, Relative Strength Index, etc.): generally precedes price movement, and is often used to generate buy and sell signals. More heavily affected by recent price changes
- Lagging (MACD, Moving Averages, etc.): is a confirmation tool because it follows price movement. It happens "after the fact".
Overbought: A technical condition that occurs when there has been a lot of buying and the price of the stock is considered too high and susceptible to a decline.
Oversold: A technical condition that occurs when there has been a lot ofselling and the price of the stock is considered too low and a rally in prices is anticipated.
Grouping indicators that complement each other can create a powerful winning combination.
