2016-07-13 08:04 (GMT+2) EUR/JPY
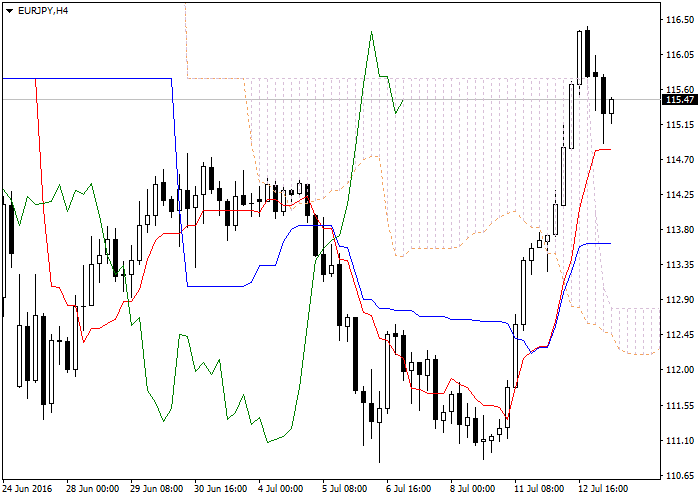

Let's look at the four-hour chart. Tenkan-sen line is
above Kijun-sen, the lines are horizontal . Confirmative line Chikou
Span is above the price chart, current cloud is descending. The
instrument has been corrected to the Tenkan-sen line. The closest
support level is Tenkan-sen line (114.80). One of the previous maximums
of Chikou Span line is expected to be a resistance level (116.35).
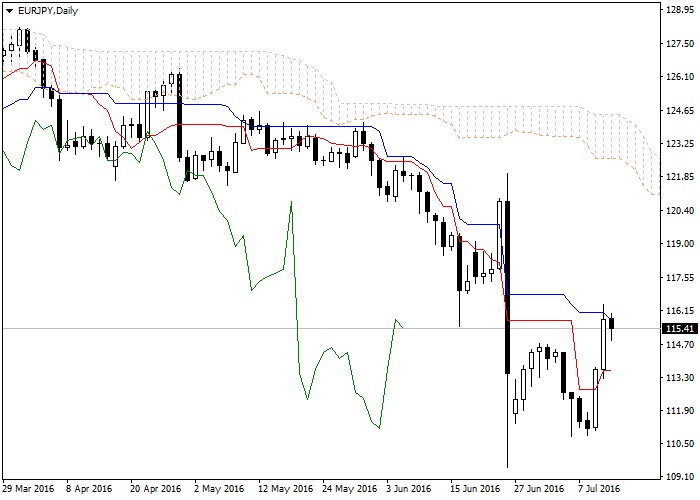
On the daily chart Tenkan-sen line is below Kijun-sen,
the blue line is directed downwards, while the red one remains
horizontal. Confirmative line Chikou Span is below the price chart,
current cloud is descending. The instrument is trading between
Tenkan-sen and Kijun-sen lines. The closest support level is Tenkan-sen
line (113.60). The closest resistance level is Kijun-sen line (115.80).
Recommendation
It is recommended to open long positions at current
price with Take Profit at the level of previous maximum of Chikou Span
(116.35) line and Stop Loss at the level of Kijun-sen line (113.60).
Scenario
| Timeframe | Intraday |
| Recommendation | BUY |
| Entry Point | 115.40 |
| Take Profit | 116.35 |
| Stop Loss | 113.60 |
| Key Levels | 113.60, 115.80 |
with
M Samer Al Reifae
Official HiWayFX Representative in Romania
samer@hiwayfx.com
+40 734 277 757
Official HiWayFX Representative in Romania
samer@hiwayfx.com
+40 734 277 757
- YOU ARE NEVER LEFT ALONE -


YOU SHOULD NOT TAKE ANY MATERIAL posted on this BLOG AS RECOMMENDATIONS
TO BUY OR SELL GOLD OR ANY OTHER INVESTMENT VEHICLE LISTED.
TO BUY OR SELL GOLD OR ANY OTHER INVESTMENT VEHICLE LISTED.
Do your own due diligence.
No one knows tomorrow's price or circumstance.
I intend to portray my thoughts and ideas on the subject which may s be used as a tool for the reader.
I do not accept responsibility for being incorrect in my speculations on market trend.
I intend to portray my thoughts and ideas on the subject which may s be used as a tool for the reader.
I do not accept responsibility for being incorrect in my speculations on market trend.