
Claws&Horns Analytics provides this
content/feature as no more than information. In particular no advice is
intended to be provided or to be relied on as provided nor endorsed by
Claws&Horns Analytics; nor any solicitation or incentive
provided to subscribe for or sell or purchase any financial instrument
or to join and/or terminate any of the trading strategies featuring as
Trading Signal solution. The Investor is solely responsible for the
choice of the signal provider, choice of trading strategy, choice
whether to join or to terminate the relevant Trading Signals feature on
his/her trading account and monitoring of the trading activities under
Trading Signals feature. All trading or investments you make must be
pursuant to your own unprompted and informed self-directed position.
Please keep in mind that past performance is no guarantee of future
results.

Current trend
Support and resistance
Trading tips


The Bonus is not granted automatically.
The client must claim / request the Bonus by
contacting finance department
or via livechat.
Terms & Conditions
2016-08-23 10:42 (GMT+2) USD/JPY
Current trend
Yesterday the pair resumed its fall despite opening with a substantial gap up.
The pair remains under pressure due to an uncertainty regarding
further actions of the US Fed. The latest FOMC Minutes showed that the
regulator is in no rush to hike interest rates. However, later comments
from some of the Fed officials suggest that opinions of its members on
the matter are divided. In addition, the Dollar is pressured by
expectations of Fed Chair Janet Yellen speech at the Jackson Hole
symposium this weekend.
At the same time, the Yen was slightly supported by statistics on the
Nikkei Manufacturing PMI. According to preliminary data, in August the
index grew from 49.3 to 49.6 points, which was 0.1 point higher than
forecasts.
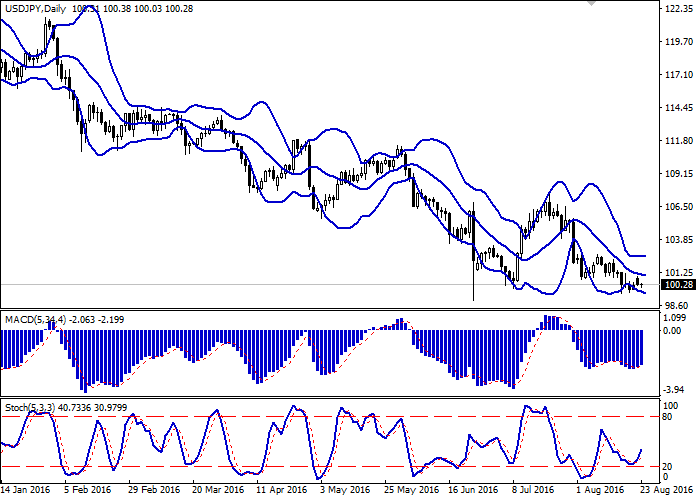
Support and resistance
Bollinger Bands on the daily chart is trying to turn horizontally
while the price range is widening from the bottom. MACD is growing and
giving a weak buy signal. Stochastic is growing as well having bounced
off the border of the oversold zone.
The indicators recommend waiting for clearer trading signals.
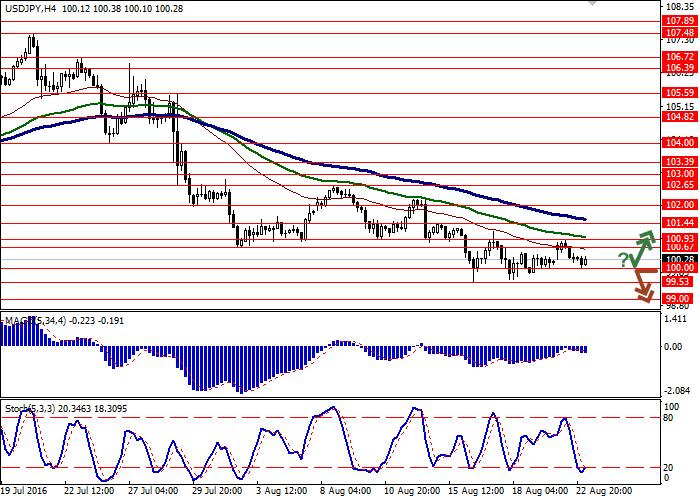
Support levels: 100.00 (psychologically important level), 99.53 (16 August low), 99.00 (24 June low).
Resistance levels: 100.67 (local high), 100.93 (local high), 101.44
(15 August high), 102.00, 102.65 (8 August high), 103.00, 103.39, 104.00
(29 July high), 104.82.
Trading tips
Long positions can be opened after the breakout of the level of
100.70 with targets at 101.40, 102.00 and stop-loss at 100.30. Validity –
2-3 days.
Short positions can be opened after the breakdown of the level of
99.70 with targets at 99.00, 98.60 and stop-loss at 100.10. Validity –
2-3 days.
Scenario
| Timeframe | Intraday |
| Recommendation | BUY STOP |
| Entry Point | 100.80 |
| Take Profit | 101.40, 102.00 |
| Stop Loss | 100.30 |
| Key Levels | 99.00, 99.53, 100.00, 100.67, 100.93, 101.44, 102.00, 102.65, 103.00, 103.39, 104.00, 104.82 |
Alternative scenario
| Recommendation | SELL STOP |
| Entry Point | 99.60 |
| Take Profit | 99.00, 98.60 |
| Stop Loss | 100.10 |

with
M Samer Al Reifae
Official HiWayFX Representative in Romania
samer@hiwayfx.com
+40 734 277 757
Official HiWayFX Representative in Romania
samer@hiwayfx.com
+40 734 277 757
- YOU WILL NEVER TRADE ALONE -


YOU SHOULD NOT TAKE ANY MATERIAL posted on this BLOG AS RECOMMENDATIONS
TO BUY OR SELL GOLD OR ANY OTHER INVESTMENT VEHICLE LISTED.
TO BUY OR SELL GOLD OR ANY OTHER INVESTMENT VEHICLE LISTED.
Do your own due diligence.
No one knows tomorrow's price or circumstance.
I intend to portray my thoughts and ideas on the subject which may s be used as a tool for the reader.
I do not accept responsibility for being incorrect in my speculations on market trend.
I intend to portray my thoughts and ideas on the subject which may s be used as a tool for the reader.
I do not accept responsibility for being incorrect in my speculations on market trend.