
Claws&Horns Analytics provides this
content/feature as no more than information. In particular no advice is
intended to be provided or to be relied on as provided nor endorsed by
Claws&Horns Analytics; nor any solicitation or incentive
provided to subscribe for or sell or purchase any financial instrument
or to join and/or terminate any of the trading strategies featuring as
Trading Signal solution. The Investor is solely responsible for the
choice of the signal provider, choice of trading strategy, choice
whether to join or to terminate the relevant Trading Signals feature on
his/her trading account and monitoring of the trading activities under
Trading Signals feature. All trading or investments you make must be
pursuant to your own unprompted and informed self-directed position.
Please keep in mind that past performance is no guarantee of future
results.


The Bonus is not granted automatically.
The client must claim / request the Bonus by
contacting finance department
or via livechat.
Terms & Conditions
2016-08-26 13:50 (GMT+2) Silver
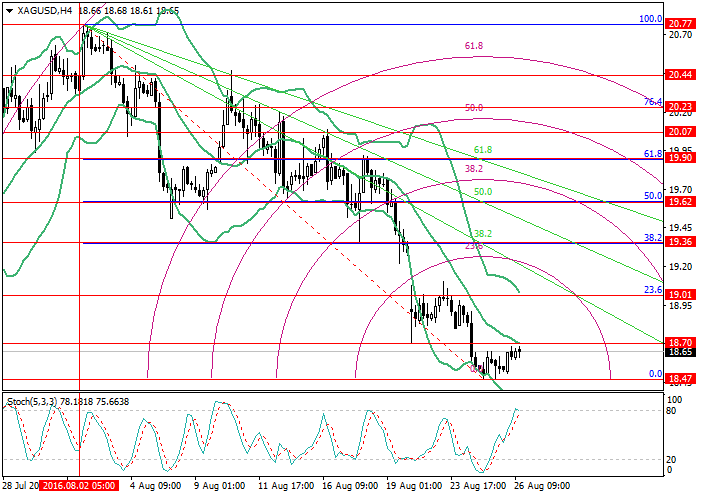
There is chance of pair’s fall while possibility of reversal and strong growth remains.
On the 4-hour chart, the price reached its August lows in the region
of 18.47 and attempted an upward correction. At present, the price
remains near the level of 18.70 (middle line of Bollinger Bands, 38.2%
correction for the medium-term trend). A breakout of this level could
lead to a growth continuation towards the level of 19.01 (23.6%
correction) and higher, through the descending fan, towards 19.36 (38.2%
correction) and 19.62 (overlap between the 50.0% and 23.6% corrections
for the short- and medium-term trends respectively). In the short-term,
however, a fall in the pair seems likely, and the price could head
towards the level 18.47, a breakdown of which would open the way to
18.26 and 17.95 (50.0% correction for the medium-term trend).
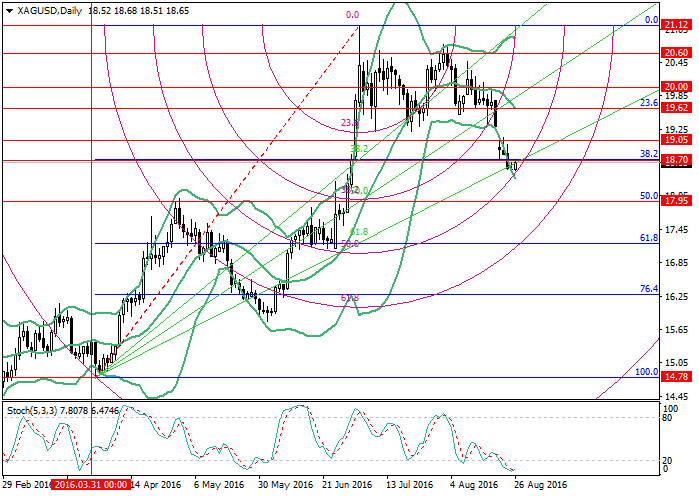
On the daily chart, the price remains at the level of 18.70 (38.2%
correction), in the region of its crossover with the ascending 61.8% fan
line and 50.0% arc. A breakout of this level, which seems likely in the
medium term (as Stochastic is turning up in the oversold zone), a
growth could continue towards the level of 19.62 (23.6% correction,
middle line of Bollinger Bands). In case of a price rebound from the
region of 18.70, a fall is possible towards the level of 17.95, to the
region of its crossover with the 61.8% arc.
Trading tips
Buy the pair in case of the breakout of the level of 18.70 with targets at 19.01, 19.36, 19.62 and stop-loss at 18.55.
Alternative scenario
Sell the pair after the price consolidation below the level of 18.47 with targets at 18.26, 17.95 and stop-loss at 18.62.
Scenario
| Timeframe | Weekly |
| Recommendation | BUY STOP |
| Entry Point | 18.75 |
| Take Profit | 19.01, 19.36, 19.62 |
| Stop Loss | 18.55 |
| Key Levels | 17.95, 18.26, 18.47, 18.70, 19.01, 19.36, 19.62 |
Alternative scenario
| Recommendation | SELL STOP |
| Entry Point | 18.42 |
| Take Profit | 18.26, 17.95 |
| Stop Loss | 18.62 |
| Key Levels | 17.95, 18.26, 18.47, 18.70, 19.01, 19.36, 19.62 |

with
M Samer Al Reifae
Official HiWayFX Representative in Romania
samer@hiwayfx.com
+40 734 277 757
Official HiWayFX Representative in Romania
samer@hiwayfx.com
+40 734 277 757
- YOU WILL NEVER TRADE ALONE -


YOU SHOULD NOT TAKE ANY MATERIAL posted on this BLOG AS RECOMMENDATIONS
TO BUY OR SELL GOLD OR ANY OTHER INVESTMENT VEHICLE LISTED.
TO BUY OR SELL GOLD OR ANY OTHER INVESTMENT VEHICLE LISTED.
Do your own due diligence.
No one knows tomorrow's price or circumstance.
I intend to portray my thoughts and ideas on the subject which may s be used as a tool for the reader.
I do not accept responsibility for being incorrect in my speculations on market trend.
I intend to portray my thoughts and ideas on the subject which may s be used as a tool for the reader.
I do not accept responsibility for being incorrect in my speculations on market trend.