
Claws&Horns Analytics provides this
content/feature as no more than information. In particular no advice is
intended to be provided or to be relied on as provided nor endorsed by
Claws&Horns Analytics; nor any solicitation or incentive
provided to subscribe for or sell or purchase any financial instrument
or to join and/or terminate any of the trading strategies featuring as
Trading Signal solution. The Investor is solely responsible for the
choice of the signal provider, choice of trading strategy, choice
whether to join or to terminate the relevant Trading Signals feature on
his/her trading account and monitoring of the trading activities under
Trading Signals feature. All trading or investments you make must be
pursuant to your own unprompted and informed self-directed position.
Please keep in mind that past performance is no guarantee of future
results.

The Bonus is not granted automatically.
The client must claim / request the Bonus by
contacting finance department
or via livechat.
2016-08-29 13:49 (GMT+2) Gold
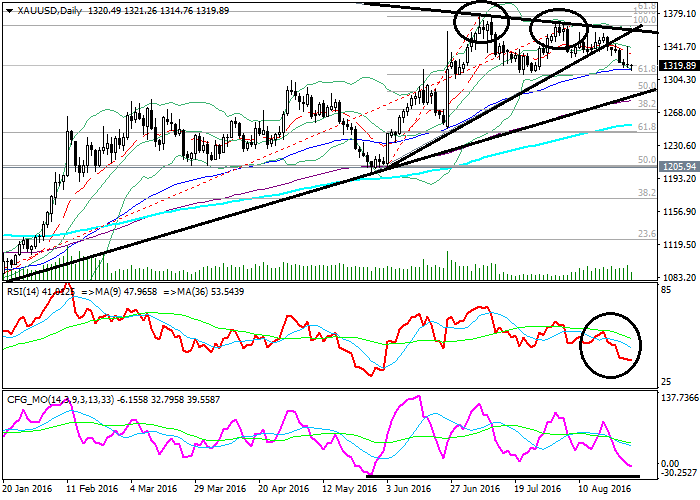
XAU/USD, D1

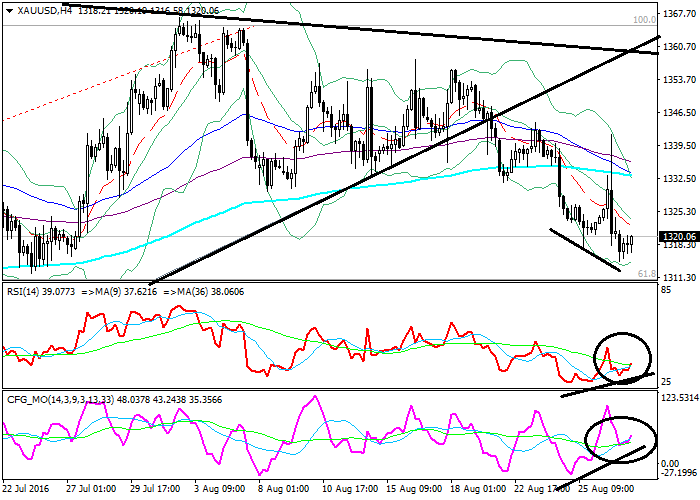
 XAU/USD, H4
Key levels
Trading tips
On the daily chart, the instrument is falling along the lower line of
Bollinger Bands. The price remains above the EMA65, EMA130 and SMA200
that are turning horizontally. The RSI is falling as it failed its
longer MA. The Composite is falling towards its strong support of the
end of May.
On the 4-hour chart, the instrument is trading in the lower Bollinger
band. The price remains below its moving averages that are turning
down. The RSI is testing its longer MA. The Composite is growing as it
failed its longer MA. Both indicators are forming a Bullish divergence
with the price.
Key levels
Support levels: 1310.66 (61.8% Fibonacci retracement for the short-term trend), 1290.61 (50% retracement), 1205.94 (May lows).
Resistance levels: 1356.07 (local highs), 1365.08 (August highs), 1422.16 (January 2011 highs).
Trading tips
The price has failed its long-term descending trendline that it
tested twice this summer. However, the trend seemed to have changed for
upward as indicated by the SMA200 on the daily and weekly charts.
Long positions can be opened from the level of 1368.08 with the target at 1419.16 and stop-loss at 1355.07.
Short positions can be opened from the level of 1285.61 with the target at 1210.94 and stop-loss at 1305.00.
Scenario
| Timeframe | Weekly |
| Recommendation | BUY STOP |
| Entry Point | 1368.08 |
| Take Profit | 1419.16 |
| Stop Loss | 1355.07 |
| Key Levels | 1205.94, 1290.61, 1310.66, 1356.07, 1365.08, 1422.16 |
Alternative scenario
| Recommendation | SELL STOP |
| Entry Point | 1285.61 |
| Take Profit | 1210.94 |
| Stop Loss | 1305.00 |
| Key Levels | 1205.94, 1290.61, 1310.66, 1356.07, 1365.08, 1422.16 |

with
M Samer Al Reifae
Official HiWayFX Representative in Romania
samer@hiwayfx.com
+40 734 277 757
Official HiWayFX Representative in Romania
samer@hiwayfx.com
+40 734 277 757
- YOU WILL NEVER TRADE ALONE -


YOU SHOULD NOT TAKE ANY MATERIAL posted on this BLOG AS RECOMMENDATIONS
TO BUY OR SELL GOLD OR ANY OTHER INVESTMENT VEHICLE LISTED.
TO BUY OR SELL GOLD OR ANY OTHER INVESTMENT VEHICLE LISTED.
Do your own due diligence.
No one knows tomorrow's price or circumstance.
I intend to portray my thoughts and ideas on the subject which may s be used as a tool for the reader.
I do not accept responsibility for being incorrect in my speculations on market trend.
I intend to portray my thoughts and ideas on the subject which may s be used as a tool for the reader.
I do not accept responsibility for being incorrect in my speculations on market trend.