
Claws&Horns Analytics provides this
content/feature as no more than information. In particular no advice is
intended to be provided or to be relied on as provided nor endorsed by
Claws&Horns Analytics; nor any solicitation or incentive
provided to subscribe for or sell or purchase any financial instrument
or to join and/or terminate any of the trading strategies featuring as
Trading Signal solution. The Investor is solely responsible for the
choice of the signal provider, choice of trading strategy, choice
whether to join or to terminate the relevant Trading Signals feature on
his/her trading account and monitoring of the trading activities under
Trading Signals feature. All trading or investments you make must be
pursuant to your own unprompted and informed self-directed position.
Please keep in mind that past performance is no guarantee of future
results.

Current trend
The price of silver continues trading near its 2-month lows. The instrument is pressured by strengthening in the US Dollar, which is being supported amid the increasing probability of an interest rate hike by the Fed this year.
Yesterday, data on the ADP Employment Change came out in the US. In August, the index showed growth of 177 thousands that was 2 thousand higher than expectations, while in July employment grew by 194 thousands (revised up from the initial 179 thousands). Data from the ADP is traditionally used as an approximate estimation of the main report, which is released later in the week. Thus, it can be assumed that Friday data will be strong as well and the Dollar will receive a new impulse to grow.
Support and resistance
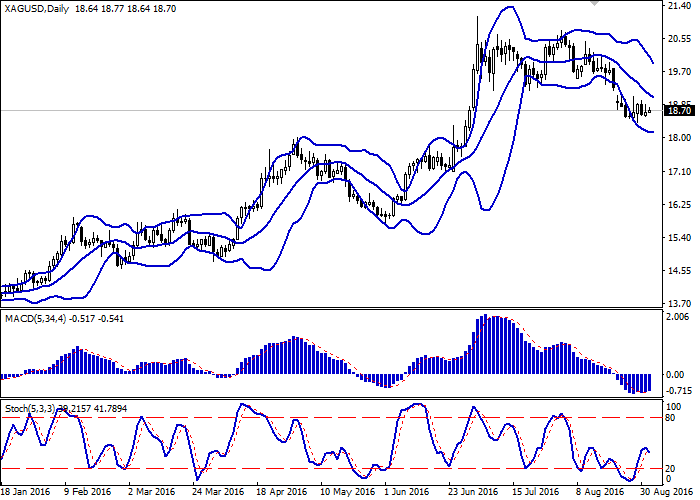
Bollinger Bands on the daily chart is moving down while the price range is narrowing from the bottom. MACD is growing and giving a weak buy signal. Stochastic is turning down again having left the oversold zone not long ago.
The indicators recommend waiting for clearer trading signals.
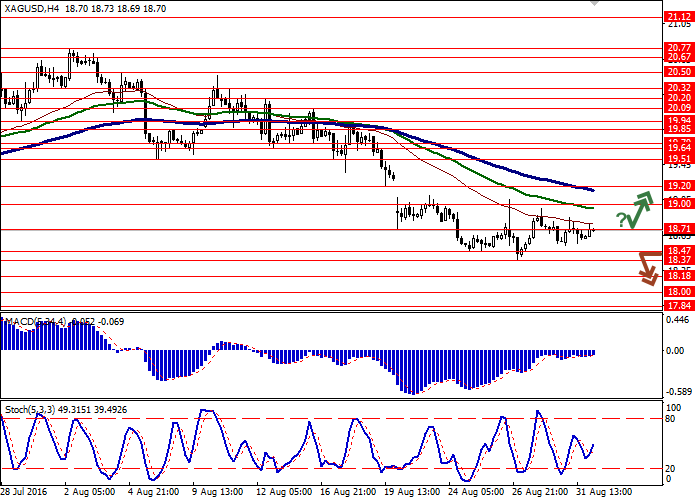
Support levels: 18.47 (local low), 18.37 (29 August low), 18.18, 18.00 (29 June low), 17.84.
Resistance levels: 18.71 (local high), 19.00 (26 August high), 19.20 (21 July low), 19.51, 19.64, 19.70, 19.85, 19.94 (18 August high).
Trading tips
Long positions can be opened after the price consolidation above the level of 18.70 with targets at 18.93, 19.11 and stop-loss at 18.50. Validity – 2-3 days.
Short positions can be opened after the breakdown of the level of 18.36 with targets at 18.00, 17.84 and stop-loss at 18.61. Validity – 2-3 days.


The Bonus is not granted automatically.
The client must claim / request the Bonus by
contacting finance department
or via livechat.
2016-09-01 10:10 (GMT+2) Silver
Current trend
The price of silver continues trading near its 2-month lows. The instrument is pressured by strengthening in the US Dollar, which is being supported amid the increasing probability of an interest rate hike by the Fed this year.
Yesterday, data on the ADP Employment Change came out in the US. In August, the index showed growth of 177 thousands that was 2 thousand higher than expectations, while in July employment grew by 194 thousands (revised up from the initial 179 thousands). Data from the ADP is traditionally used as an approximate estimation of the main report, which is released later in the week. Thus, it can be assumed that Friday data will be strong as well and the Dollar will receive a new impulse to grow.
Support and resistance
Bollinger Bands on the daily chart is moving down while the price range is narrowing from the bottom. MACD is growing and giving a weak buy signal. Stochastic is turning down again having left the oversold zone not long ago.
The indicators recommend waiting for clearer trading signals.
Support levels: 18.47 (local low), 18.37 (29 August low), 18.18, 18.00 (29 June low), 17.84.
Resistance levels: 18.71 (local high), 19.00 (26 August high), 19.20 (21 July low), 19.51, 19.64, 19.70, 19.85, 19.94 (18 August high).
Trading tips
Long positions can be opened after the price consolidation above the level of 18.70 with targets at 18.93, 19.11 and stop-loss at 18.50. Validity – 2-3 days.
Short positions can be opened after the breakdown of the level of 18.36 with targets at 18.00, 17.84 and stop-loss at 18.61. Validity – 2-3 days.
Scenario
| Timeframe | Intraday |
| Recommendation | BUY STOP |
| Entry Point | 18.71 |
| Take Profit | 18.93, 19.11 |
| Stop Loss | 18.50 |
| Key Levels | 17.84, 18.00, 18.18, 18.37, 18.47, 18.71, 19.00, 19.20, 19.51, 19.64, 19.70, 19.85, 19.94 |
Alternative scenario
| Recommendation | SELL STOP |
| Entry Point | 18.35 |
| Take Profit | 18.00, 17.84 |
| Stop Loss | 18.61 |
| Key Levels | 17.84, 18.00, 18.18, 18.37, 18.47, 18.71, 19.00, 19.20, 19.51, 19.64, 19.70, 19.85, 19.94 |

with
M Samer Al Reifae
Official HiWayFX Representative in Romania
samer@hiwayfx.com
+40 734 277 757
Official HiWayFX Representative in Romania
samer@hiwayfx.com
+40 734 277 757
- YOU WILL NEVER TRADE ALONE -


YOU SHOULD NOT TAKE ANY MATERIAL posted on this BLOG AS RECOMMENDATIONS
TO BUY OR SELL GOLD OR ANY OTHER INVESTMENT VEHICLE LISTED.
TO BUY OR SELL GOLD OR ANY OTHER INVESTMENT VEHICLE LISTED.
Do your own due diligence.
No one knows tomorrow's price or circumstance.
I intend to portray my thoughts and ideas on the subject which may s be used as a tool for the reader.
I do not accept responsibility for being incorrect in my speculations on market trend.
I intend to portray my thoughts and ideas on the subject which may s be used as a tool for the reader.
I do not accept responsibility for being incorrect in my speculations on market trend.