Fundamentals
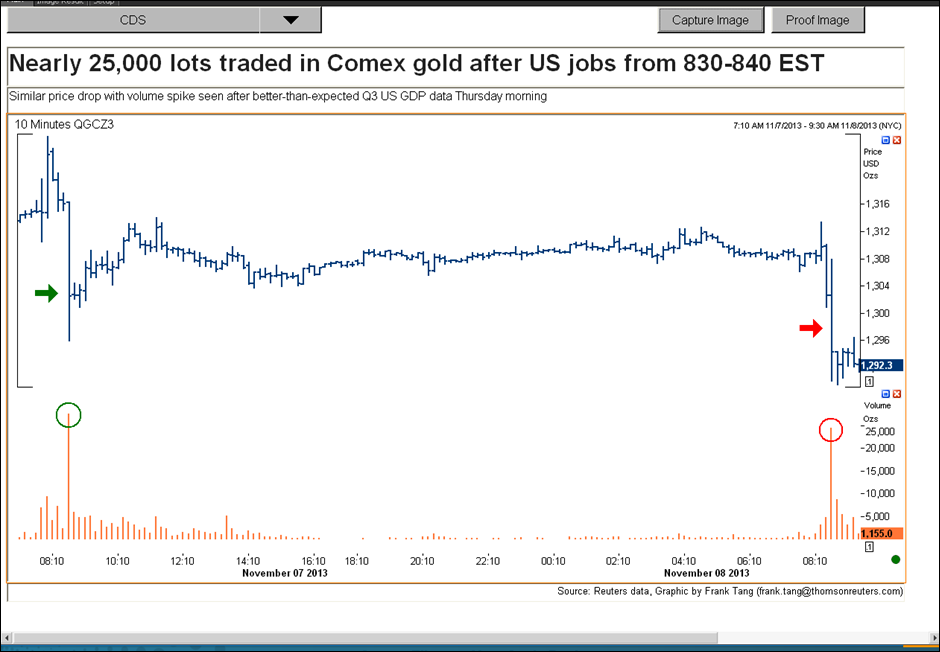
On gold market we see dramatic action now. As Reuters reports gold
dropped 1.7 percent on Friday, notching its biggest one-day fall in more
than a month, as surprisingly strong U.S. jobs data raised the prospect
that the Federal Reserve may soon decide to temper its bond-buying
stimulus. A flurry of sell orders in heavy volume sent U.S. gold futures
over $10 lower just minutes after the October nonfarm payrolls data,
setting a weaker tone for the rest of the day. A similar move in gold
futures was also seen after Thursday's strong GDP report – take a look at the chart:
U.S.
job growth unexpectedly accelerated in October, with employers adding
204,000 jobs, while 60,000 more jobs were created in September and
August than previously reported, the Labor Department said. "Those
payroll numbers made the folks who buy gold nervous as they did not go
in the direction they wanted to see, suggesting that tapering could be
back on the table," said Axel Merk, chief investment officer at
California-based Merk Funds, which have $450 million assets under
management. Gold has lost about a fifth of its value this year due to
fears the Fed would begin cutting back its $85 billion monthly bond
purchases. The metal's inflation -hedge
appeal has been burnished by the bond purchases and low interest rates.
"At the moment, the market is looking at underlying growth and can see
how the U.S. is accelerating and that very simply leads to tapering one
way or another, which is obviously not bullish for gold," BofA Merrill Lynch analyst Michael Widmer said.
The metal had managed a rebound in recent weeks after a prolonged budget battle in Washington in October led investors to believe the Fed may not start withdrawing support for the economy and possibly push the tapering into next year. However, after Friday's strong jobs report, some economists said it would be unwise to rule out chances the Fed could curtail its bond-buying as soon as its next meeting in December.
CFTC data shows significant increase of short positions. Although gold still stands as net long, but there was a solid contraction of it. Another moment that we see here is that this contraction of net long position is not supported by open interest. It is difficult to expect this moment. If we would see growing open interest previously and its contraction now – that easily could be explained. But, as you can see open interest stands flat and shows no reaction on whether increasing or decreasing net position.
Monthly
Weekly
Daily
4-hour
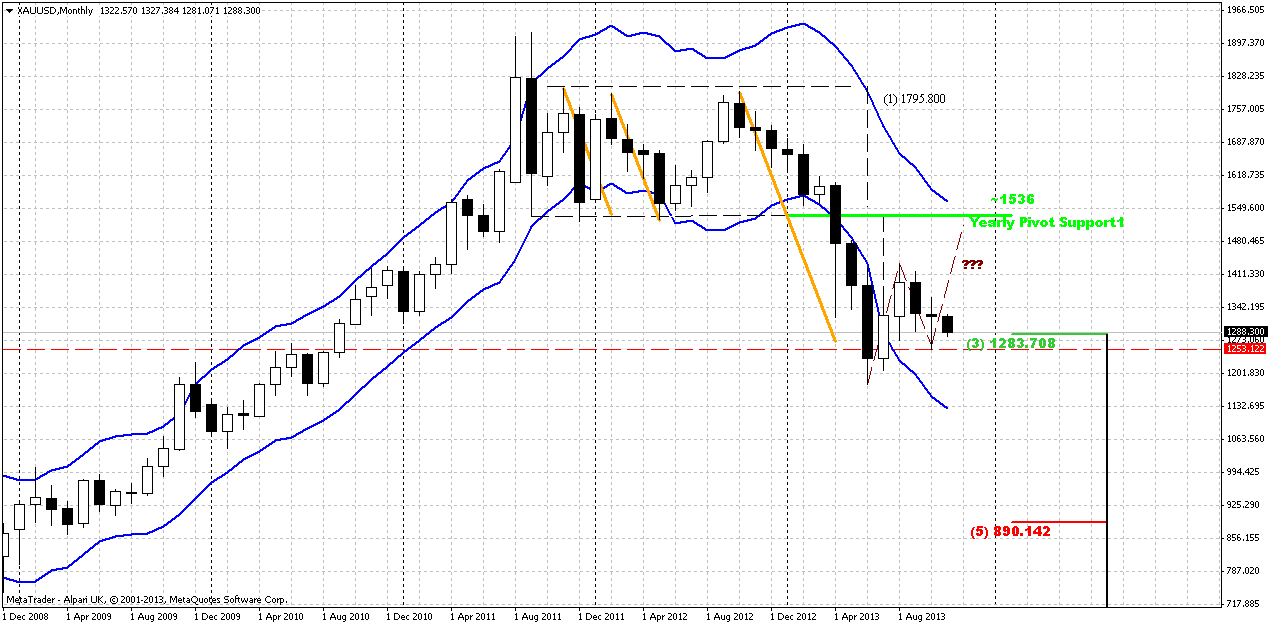
Whether we will get upward retracement and possible BC leg of larger
AB=CD down move or not – that was our question for previous months.
Chances on this event are melting. While october has shifted to doji
right in the end of the month, November is started to show its face and
moving down. Currently this action does not look like possible upward
reversal and starting point of notable retracement up. Fundamental
situation and CFTC data also stand not in favor of possible
appreciation. Seasonal trend is still bullish, but it is not always lead
to growth. Sometimes, it could just hold depreciation and now we see
something of this kind, since market stands in some range since August.
Our previous analysis (recall volatility breakout - VOB) suggests upward retracement. As market has significantly hit oversold we’ve suggested that retracement up should be solid, may be not right to overbought, but still significant. Take a look at previous bounces out from oversold – everytime retracement was significant. Thus, we’ve made an assumption of possible deeper upward retracement that could take a shape of AB=CD, and invalidation for this setup is previous lows around 1170s. If market will pass through it, then, obviously we will not see any AB=CD up.
Now market is approaching to previous lows and probably will take a second challenge of major 1283 Fib support. Once it has been tested already. The second test will clarify situation on monthly chart, probably. If price will hold around 1200, it could turn to weekly Double Bottom and our upward reaction on strong oversold and VOB could start. But if price will break through it – then we will continue move down, since market is not at oversold now and has a lot of free space till 1130.
That’s being said, current situation on monthly chart looks mostly as indecision, although theoretical chances for upward continuation still exist. At the same time growing concern of investors about QE tapering and CFTC data in long term perspective could change picture on monthly chart.
Weekly
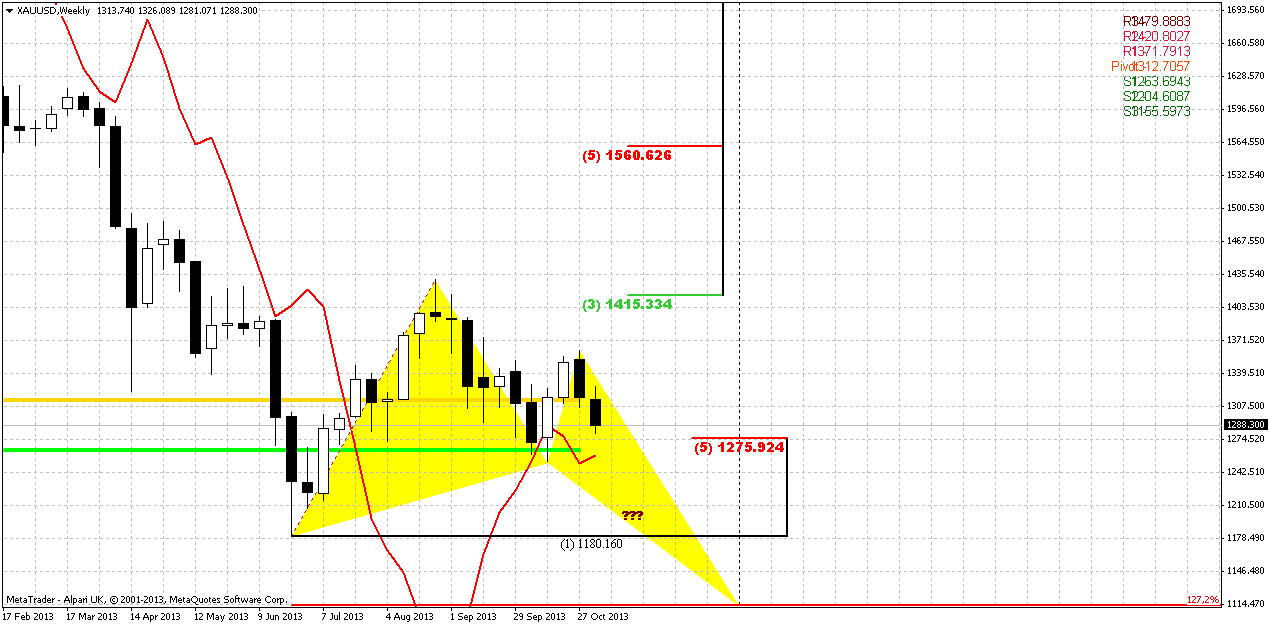
On previous week we’ve discussed the reasons why we think that situation
here looks bearish. First is, take a look – market has shown reversal
without any technical reasons, price is not at resistance or overbought.
When price stands in upward AB=CD it should not show reversals prior
hitting at least minor 0.618 target. But here we see solid downward move
right after appearing of potential “C” point of AB=CD pattern. Second –
action has taken a shape of bearish engulfing and price has moved below
MPP. Based on this chart, possible point of return to bullish sentiment
and trend is breakout through 1380 top. Until that will happen,
engulfing pattern will hold and situation will remain bearish in
short-term. Also, keep in mind guys, that current action easily could
shift to Butterfly “buy” as we’ve suggested previously. If this will
happen market will be under way to 1115 and 1025 areas.
Appearing on engulfing pattern probably will return market to second test of 1250-1275 support area. It includes 5/8 Fib support and MPS1. Despite on strong action in recent month, CFTC data suggests that all this action happened and is happening without new opening position, since open interest stands the same. This puts us to conclusion that may be market still indecision, despite solid action that we see. It means that big market participants make money on some tactical trading, but major game will start after breakout in any direction and one of the key levels here is 1170 lows.
In short-term perspective we have enough room till 1250 and probably will search possibility for short entry.
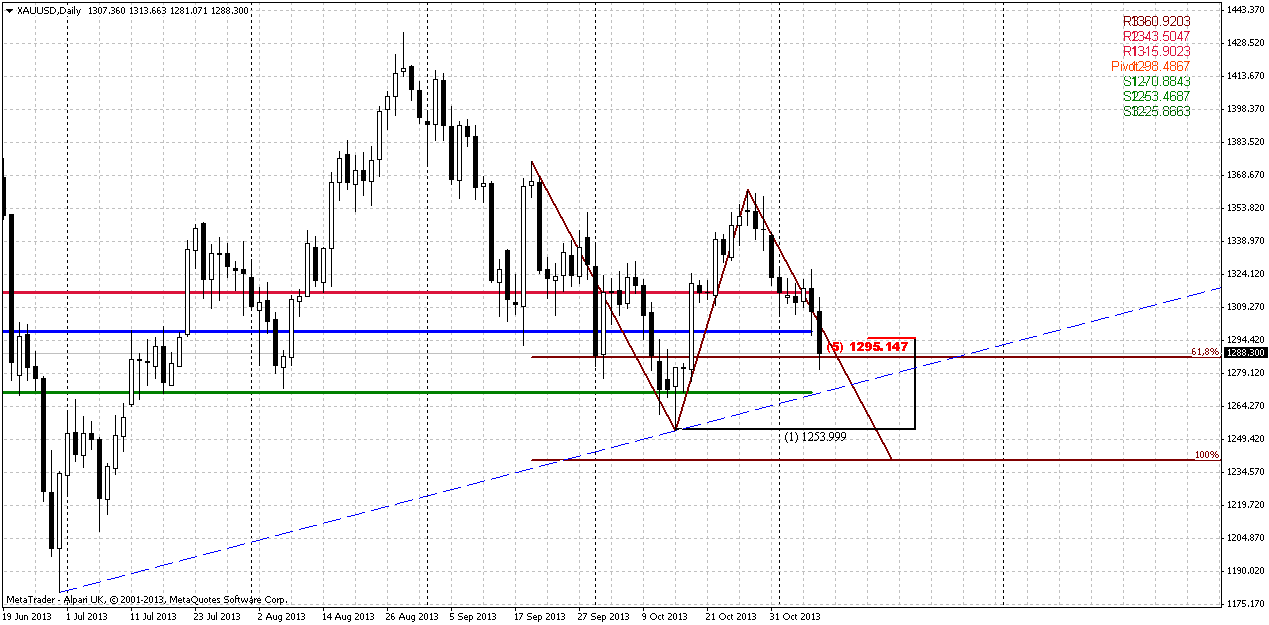
Daily
Trend is bearish here, market is not at oversold. On Friday market has
hit 5/8 Fib support and minor 0.618 AB-CD target. Previous action down
is solid and if it will continue, next target will be 1240 that will
lead to taking out previous 1254 lows. Still as market stands at support
we could get a bounce up and try to use for short entry. Also, take a
look – on the way down price will meet significant area – crossing of
WPS1 and major trend line around 1270. Passing through it is 50% success
to 1240.
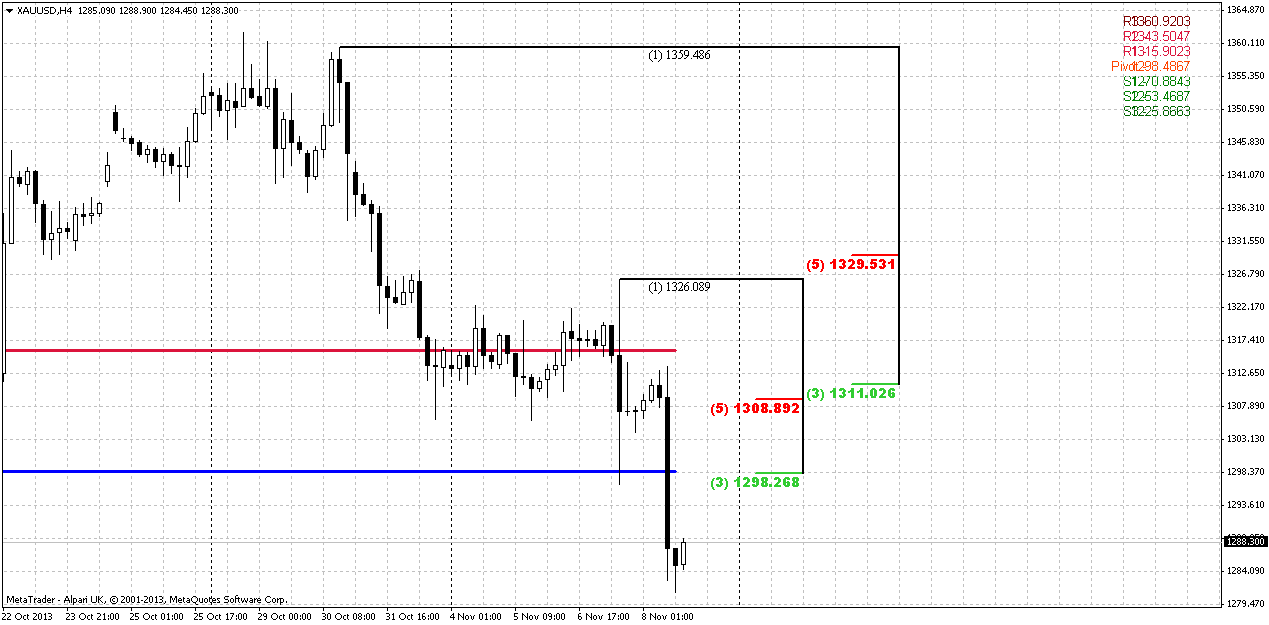
4-hour
As market has hit just minor AB-CD target on daily time frame,
retracement should not be too deep probably. It seems that K-resistance
1308-1311 and higher stand WPR1 is nice area for possible
re-establishing downward action. Also prior this level we have
combination of WPP and Fib resistance around 1300.
Conclusion
Overall long-term picture gradually is shifting to bearish
around the gold market. Currently major investors stands indecision or
do not take active part on gold market and do not hurry to increase
positions, as it follows from CFTC data. This situation probably will
hold until market is flirting inside wide triangle that we once
discussed on daily chart. But as soon as price will break through it
(and this could happen on next week already), this probably could
involve more traders and lead to inflow of new money. In short-term period market looks bearish and we will try to use possible rally up for short entry.

and start earning commissions from all
the trading activity of the clients you referred to XM.
The Advantages of Promoting XM:
The Highest Conversion in the Industry
Ability to transfer funds between IB account from/to client account
No limits on how much you can earn
No limits on how much you get paid every month
Fastest and most reliable IB payouts
Transparent reporting and detailed statistics
Account Managers in more than 18 languages
Leverage up to 1:888 for your Clients
Low Minimum Deposit for your Clients
Multiple Deposit Options for your Clients
Monthly Timely Payments
Tailor-Made Solutions
No Fees to Start
Multiple Platforms to Promote
Flexible Commission Rates
Unlimited Banners and Artwork
Nonstop Promotions for your Clients
The Partner Promotion for 2013 Offers
| Clients | Commission on Currencies | Commission on Gold | Second Tier (Sub Ib's) |
|---|---|---|---|
| 3-10 | $7 | $25 | 10% |
| 11-30 | $8 | $25 | 10% |
| 31+ | $10 | $25 | 10% |

Get paid to trade Gold in 3 easy steps.
1. Open your account HERE
2. Send me your MT4 trading account number and email address
3. Send me your Paypal or Moneybookers account number
If you do not have a Paypal or Moneybookers account,
please click on one of the links below to open your free account today.
Moneybookers
Paypal
You will be paid $10 per standard lot of Gold traded and
all payments will be made by the 25th of each month.
 In order for your payment to be processed each month, please send me an email requesting payment and stating the amount of lots you have traded and your MT4 account number between the 20th and 24th of the month.
thelordoftruth@gmail.com

1. Open your account HERE
2. Send me your MT4 trading account number and email address
3. Send me your Paypal or Moneybookers account number
If you do not have a Paypal or Moneybookers account,
please click on one of the links below to open your free account today.
Moneybookers
Paypal
You will be paid $10 per standard lot of Gold traded and
all payments will be made by the 25th of each month.
thelordoftruth@gmail.com
The Gold Price & Trend Predictions blog made for gold traders to find good news and to provide the traders with daily price predictions and to learn how to trade the Forex Market for free.Just pure learning! It will be of great fun.You can judge by yourself the quality of information that I will be giving you in my blog.
Welcome to my blog where you can learn how to trade the Forex Market for free.The material is all created by myself and not copied from anywhere. There is a lot yet to come since there is a lot that you need to learn, and there is a lot that I need to share with you! So please just be patient – it will be worth it.You can judge by yourself the quality of information that I will be giving you . So just go now and start learning!
Below is a quick guide of how this website is structured, so you can find what you are looking for fast. Remember that I update the pages every day so either check back often.
In this section you will find quite a long article of what Forex is all about. If you are a beginner, this is a must read. It explains in detail what is required to start trading, what you should do and not, typical traps to avoid as a beginner and a lot of valuable information which you as a beginner must digest and learn prior opening any Forex account with real money.
In this section you will find your road map on how to become a real successful trader couple of months as from today.
In this section you will know the 3 major areas – Technical Analysis, Fundamental Analysis and Trading Physcology.
In this section you will find a gold mine of information about the technicalities of Forex. We will start from the very basics covering all the Forex jargon words which you will be hearing every day and we will be taking you up to the level required to finally learn to trade like a pro – technical analysis, also found in this section.
In this section you will see the tips that will help you stay away from crap forex products, which unfortunately the Forex market is invaded with.
This section has a very detailed article on how to avoid being scammed in this ruthless world of Forex. I will explain in detail six tips that you need to look for prior purchasing any products. Even though most of the time you may claim your money back,the time wasted is never returned. You should have used that time to learn how to trade! Read it!


YOU SHOULD NOT TAKE ANY MATERIAL posted on this BLOG AS RECOMMENDATIONS
TO BUY OR SELL GOLD OR ANY OTHER INVESTMENT VEHICLE LISTED.
TO BUY OR SELL GOLD OR ANY OTHER INVESTMENT VEHICLE LISTED.
Do your own due diligence.
No one knows tomorrow's price or circumstance.
I intend to portray my thoughts and ideas on the subject which may s be used as a tool for the reader.
I do not accept responsibility for being incorrect in my speculations on market trend.
I intend to portray my thoughts and ideas on the subject which may s be used as a tool for the reader.
I do not accept responsibility for being incorrect in my speculations on market trend.
King Regards