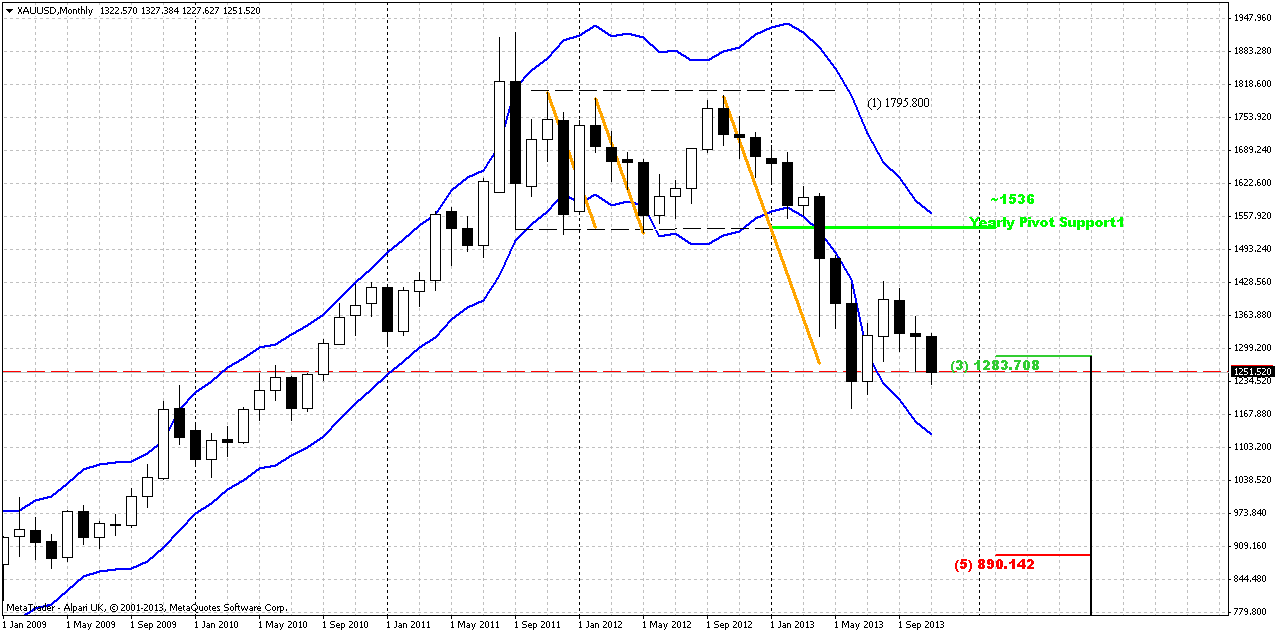
Monthly
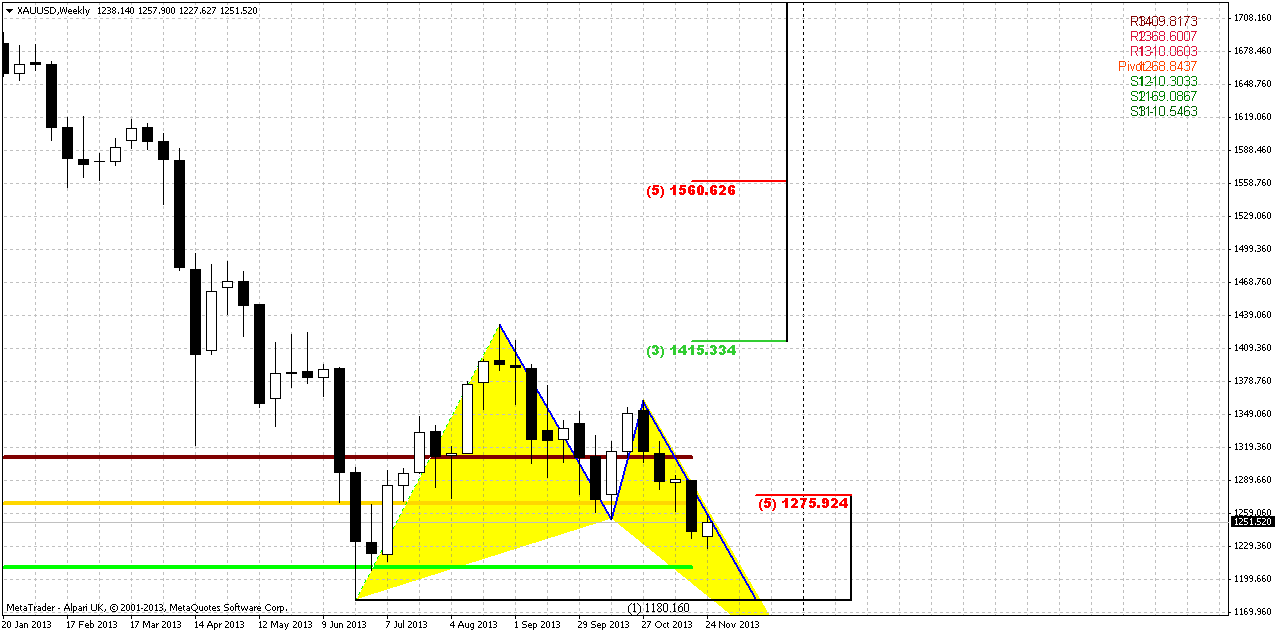
Weekly
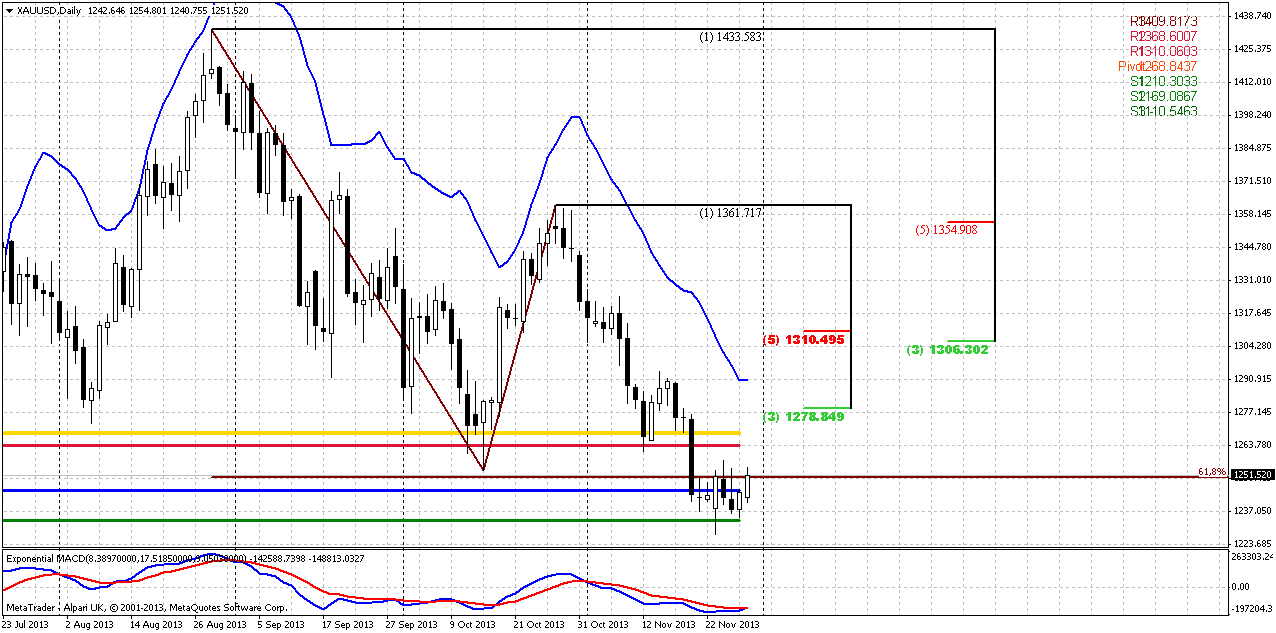
Daily
4-hour
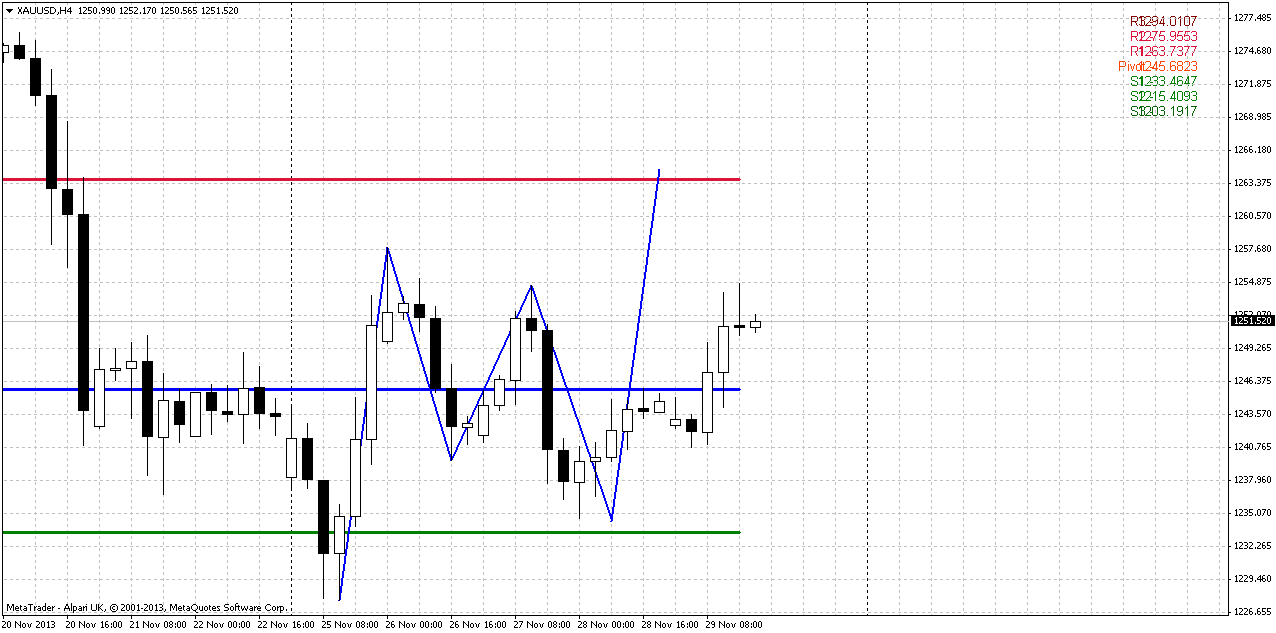
1-hour
Whether we will get upward retracement and possible BC leg of larger
AB=CD down move or not – that was our question for previous months and
not much has changed here by far. And looks like bullish sunshine was
not as long as it could. Market has moved and closed below October lows.
Fundamental situation and CFTC data stand not in favor of possible
appreciation. Seasonal trend is still bullish, but it is not always lead
to growth. Sometimes, it could just hold depreciation and now we see
something of this kind, since market stands in some range since August.
Our previous analysis (recall volatility breakout - VOB) suggests upward
retracement. As market has significantly hit oversold we’ve suggested
that retracement up should be solid, may be not right to overbought, but
still significant. Take a look at previous bounces out from oversold –
everytime retracement was significant. Thus, we’ve made an assumption of
possible deeper upward retracement that could take a shape of AB=CD,
and invalidation for this setup is previous lows around 1170s. If market
will pass through it, then, obviously we will not see any AB=CD up. And
now, as market has broken through 1250, next target is precisely
previous lows around 1180. In fact this will be the last chance for
possible upward bounce, if, say, market will shows something like double
bottom. Price is not at oversold right now and not at major support, so
really bearish market should reach previous lows level.
Weekly
Overall context here is bearish as well. As we’ve said previously, price
has broken through major 5/8 Fib support and MPS1. Also, currently
market stably holds below 1250 lows and minor 0.618 AB-CD target. As
market has not shown any failure breakout or W&R, although it could,
this tells that bearish intentions probably rather solid. Here we have
two possible scenarios. First one is completion of AB-CD pattern right
around 1180 lows and second one is butterfly – it has target around 1110
area. On the road to 1180 there is new WPS1=1210. Thus as monthly as
weekly charts point on possible continuation, so any bounce should be
used probably for short entry.
Daily
So, guys we didn’t get the stop grabber here and trend has turned
bullish. Almost whole previous week market has looked heavy and we’ve
started to doubt with possible retracement up. But right on Friday
market has become alive and even has shown something like rally. Thus,
may be some retracement up is still possible. If we will get it, then
first area where it could finish is 1263-1278 that includes MPP, WPR1
and Fib resistance level. Also this will be re-testing of broken 1250’s
lows and previously broken 1275 major Fib support on weekly chart.
Hardly market will proceed to K-resistance at 1306-1310, since it stands
beyond overbought on current week. But theoretically K-resistance is
ultimate level after reaching just minor AB-CD extension. Any higher
move should be treated as a hazard for downward continuation.
4-hour
Looks like old trader’s wisdom “take first AB-CD after reverse swing
and go” has worked again. We almost have begun to doubt possible rebound
here, but suddenly it has started at the end of Friday, when market
even has reached minor 0.618 target of our “222” Buy pattern. Next
target stands in a Agreement with WPR1 and this is lower border of our
resistance cluster. Any move below WPS1 will mean that retracement
probably is over and price is ready for downward continuation.
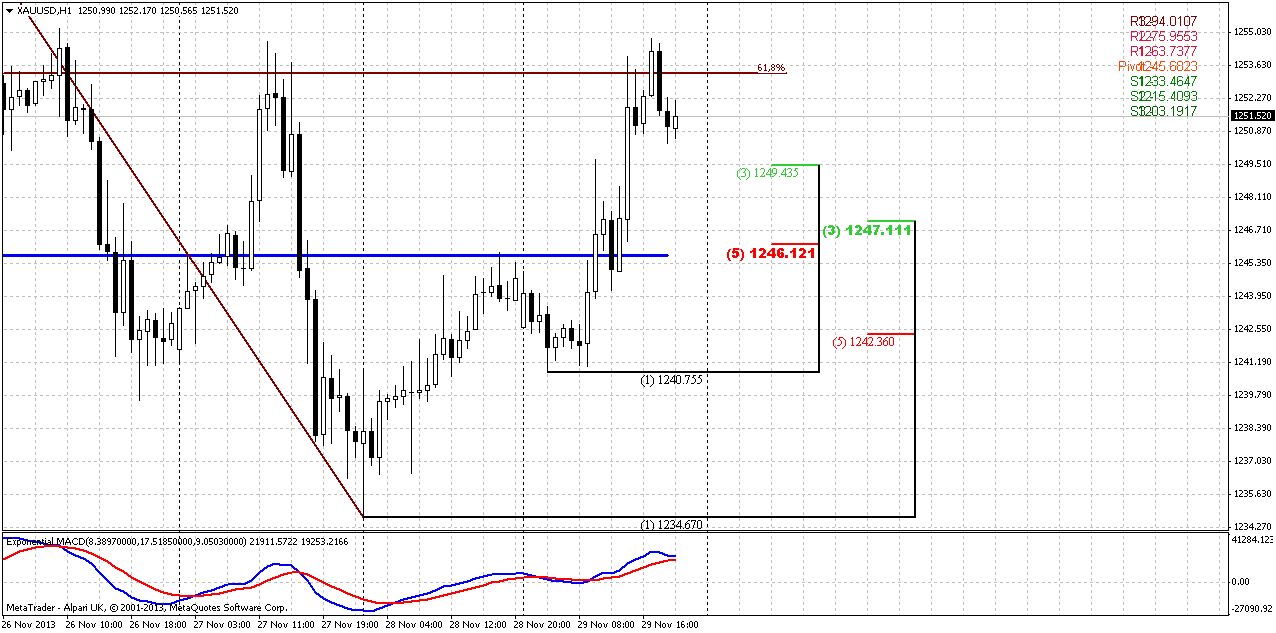
1-hour
On Monday we have to focus on hourly chart. As we’ve mentioned that
market has hit minor 0.618 AB=CD target – it has formed bearish
engulfing on hourly chart as a respect of this target. Thus, some at
least minor bounce down probably should follow. The level that we will
monitor is 1246-1247 K-support +WPP. This is some kind of indicator.
Since price has hit minor target – it should not show deep retracement
if it still intends move higher. That’s why if it will break through it –
that will be a first bell of possible downward continuation. Besides,
market simultaneously will move below WPP and shift sentiment to
bearish. Here I do not call you to take long position, because this is
not suggested by daily analysis. But if you a scalp trader, may be this
will be useful for your trading plan. For daily traders - we need just
to get signs of weakness whatever they will be – breakout here, through
WPP, or continuation to next target and appearing some reversal pattern
there or any other, since our current context is bearish.
Conclusion
In short-term perspective market stands with retracement up. As signs of weakness or retracement’ ending will appear – we should start search possibility to enter short. Next target down will be 1180 lows.
In short-term perspective market stands with retracement up. As signs of weakness or retracement’ ending will appear – we should start search possibility to enter short. Next target down will be 1180 lows.

Become an XM IB or Affiliate Partner today
and start earning commissions from all
the trading activity of the clients you referred to XM.
The Advantages of Promoting XM:
The Highest Conversion in the Industry
Ability to transfer funds between IB account from/to client account
No limits on how much you can earn
No limits on how much you get paid every month
Fastest and most reliable IB payouts
Transparent reporting and detailed statistics
Account Managers in more than 18 languages
Leverage up to 1:888 for your Clients
Low Minimum Deposit for your Clients
Multiple Deposit Options for your Clients
Monthly Timely Payments
Tailor-Made Solutions
No Fees to Start
Multiple Platforms to Promote
Flexible Commission Rates
Unlimited Banners and Artwork
Nonstop Promotions for your Clients
The Partner Promotion for 2013 Offers
| Clients | Commission on Currencies | Commission on Gold | Second Tier (Sub Ib's) |
|---|---|---|---|
| 3-10 | $7 | $25 | 10% |
| 11-30 | $8 | $25 | 10% |
| 31+ | $10 | $25 | 10% |

Get paid to trade Gold in 3 easy steps.
1. Open your account HERE
2. Send me your MT4 trading account number and email address
3. Send me your Paypal or Moneybookers account number
If you do not have a Paypal or Moneybookers account,
please click on one of the links below to open your free account today.
Moneybookers
Paypal
You will be paid $10 per standard lot of Gold traded and
all payments will be made by the 25th of each month.
 In order for your payment to be processed each month, please send me an email requesting payment and stating the amount of lots you have traded and your MT4 account number between the 20th and 24th of the month.
thelordoftruth@gmail.com

1. Open your account HERE
2. Send me your MT4 trading account number and email address
3. Send me your Paypal or Moneybookers account number
If you do not have a Paypal or Moneybookers account,
please click on one of the links below to open your free account today.
Moneybookers
Paypal
You will be paid $10 per standard lot of Gold traded and
all payments will be made by the 25th of each month.
thelordoftruth@gmail.com
The Gold Price & Trend Predictions blog made for gold traders to find good news and to provide the traders with daily price predictions and to learn how to trade the Forex Market for free.Just pure learning! It will be of great fun.You can judge by yourself the quality of information that I will be giving you in my blog.
Welcome to my blog where you can learn how to trade the Forex Market for free.The material is all created by myself and not copied from anywhere. There is a lot yet to come since there is a lot that you need to learn, and there is a lot that I need to share with you! So please just be patient – it will be worth it.You can judge by yourself the quality of information that I will be giving you . So just go now and start learning!
Below is a quick guide of how this website is structured, so you can find what you are looking for fast. Remember that I update the pages every day so either check back often.
In this section you will find quite a long article of what Forex is all about. If you are a beginner, this is a must read. It explains in detail what is required to start trading, what you should do and not, typical traps to avoid as a beginner and a lot of valuable information which you as a beginner must digest and learn prior opening any Forex account with real money.
In this section you will find your road map on how to become a real successful trader couple of months as from today.
In this section you will know the 3 major areas – Technical Analysis, Fundamental Analysis and Trading Physcology.
In this section you will find a gold mine of information about the technicalities of Forex. We will start from the very basics covering all the Forex jargon words which you will be hearing every day and we will be taking you up to the level required to finally learn to trade like a pro – technical analysis, also found in this section.
In this section you will see the tips that will help you stay away from crap forex products, which unfortunately the Forex market is invaded with.
This section has a very detailed article on how to avoid being scammed in this ruthless world of Forex. I will explain in detail six tips that you need to look for prior purchasing any products. Even though most of the time you may claim your money back,the time wasted is never returned. You should have used that time to learn how to trade! Read it!


YOU SHOULD NOT TAKE ANY MATERIAL posted on this BLOG AS RECOMMENDATIONS
TO BUY OR SELL GOLD OR ANY OTHER INVESTMENT VEHICLE LISTED.
TO BUY OR SELL GOLD OR ANY OTHER INVESTMENT VEHICLE LISTED.
Do your own due diligence.
No one knows tomorrow's price or circumstance.
I intend to portray my thoughts and ideas on the subject which may s be used as a tool for the reader.
I do not accept responsibility for being incorrect in my speculations on market trend.
I intend to portray my thoughts and ideas on the subject which may s be used as a tool for the reader.
I do not accept responsibility for being incorrect in my speculations on market trend.
King Regards