Follow The XM Bull
Monthly
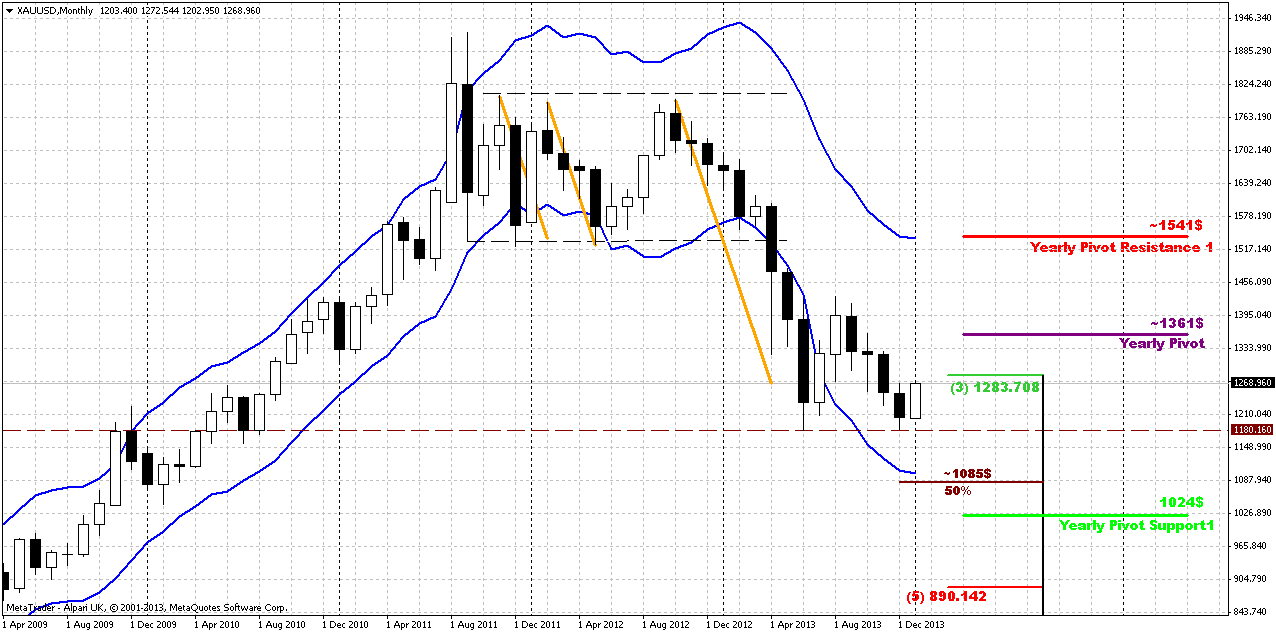
January has started with upward action. There is just 1 week till the
end of the month and market has shown upward action again. As a result
this could lead to appearing of monthly bullish engulfing pattern. Trend
holds bearish. Appearing of 1361 Yearly PP could get special meaning
from possible retracement point of view. It could become possible
nearest upside target. Yearly PR1 is also very significant. We know that
gold likes to re-test previously broken lows and consolidations. 1540
area is monthly overbought, YPR1 and low border of broken long-term
rectangle. As market was strongly oversold, why it can’t reach
overbought? This is very typical action for any market. As another application of significantly oversold we’ve suggested retracement up. Thus, we’ve made an assumption of possible deeper upward retracement that could take a shape of AB=CD, and invalidation for this setup is previous lows around 1170s. In fact current move up could be the last chance for possible upward bounce, if, say, market will show something like double bottom. Currently price action is very suitable for that – W&R of first bottom. This action in general is very typical for double bottoms and fake breakout could be the first sign of possible retracement up. Bearish market has no other reasons to stop right here, since there is no support right now – it has passed through 3/8 support, it’s not at oversold. Currently we should keep a close eye on move up.
At the same time fundamental data, seasonal trend, physical demand and CFTC recent data do not quite support upward action, at least right now. May be a bit later situation will change, but market will enter seasonal bearish trend in February and it will be even more difficult to continue move higher.
Weekly
Trend has shifted bullish here. Upward action couldn’t get solid
momentum yet, but on every week we see move down first, reversal and
close at new highs by the end of the week. Take a look at long lower
shadows of candles since move up has started. Price’s move is very
gradual. Initially we’ve thought that this could become butterfly “buy”
pattern, but it also could be “222” Buy, since if we’ve suggested that
AB=CD has been completed and W&R really has happened, this could be
double bottom. Also take a look, we have solid bullish divergence with
MACD. By treating valleys as AB=CD pattern we’ll see that minor
extension stands almost right at Yearly Pivot Point, and 1.618 extension
stands slightly higher than Yearly PR1. This is really interesting
agreement. Weekly chart points that we should search possibility for
long entry. Odds suggest that after AB=CD completion market usually
shows at minimum 3/8 retracement, and on the weekly chart this will be
not small move. This, of cause, makes sense only if W&R of 1180 lows
really has happened. If we will be wrong with this suggestion then we
will get the trap that we’ve discussed previously. But on previous week
we’ve got another moment that should add some more confidence with
upward continuation – price has closed above MPR1. 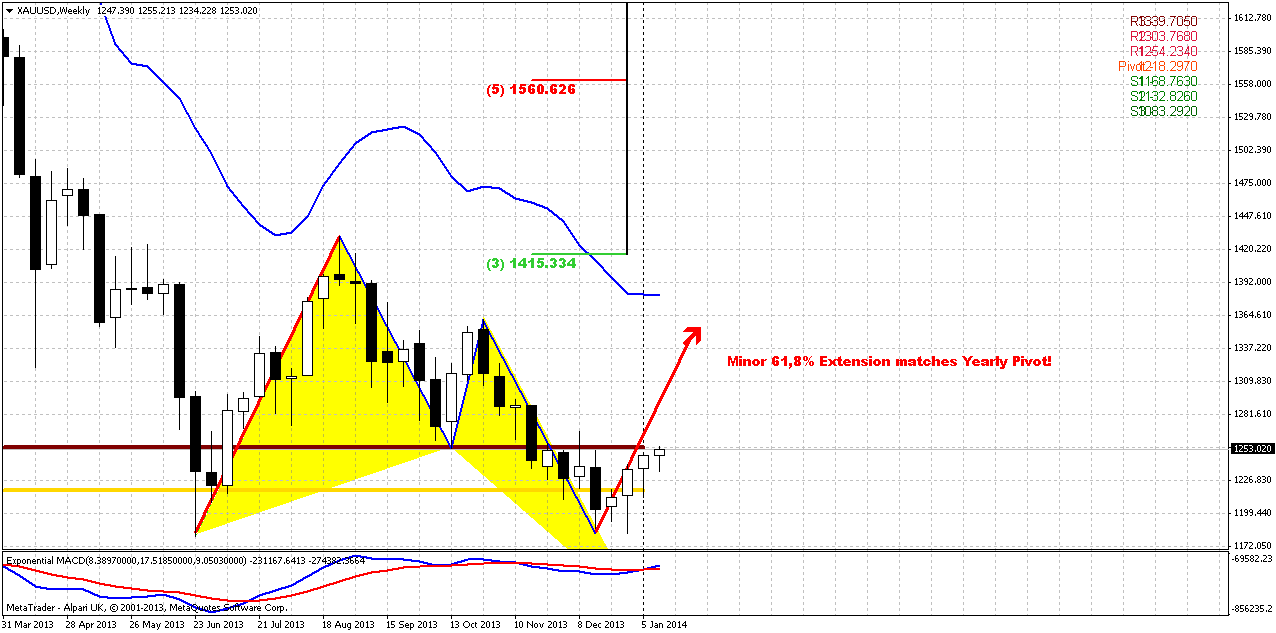
Daily
As usual, guys, if something is too obvious on the market – be ready for
troubles. Here we’ve got it again – H&S is really obvious here and
some unexpected shifting has followed. Instead of forming right shoulder
market now is doing an attempt to go higher. But hardly market will
pass too far. Slightly higher daily K-resistance and WPR1 stands. Now
the major question is – whether we will get right shoulder finally or
not, or we should treat recent consolidation as right shoulder. At my
opinion if this really would be H&S, recent consolidation is too
small to treat it as shoulder. Some bigger retracement down should come
to keep the harmony of the pattern. 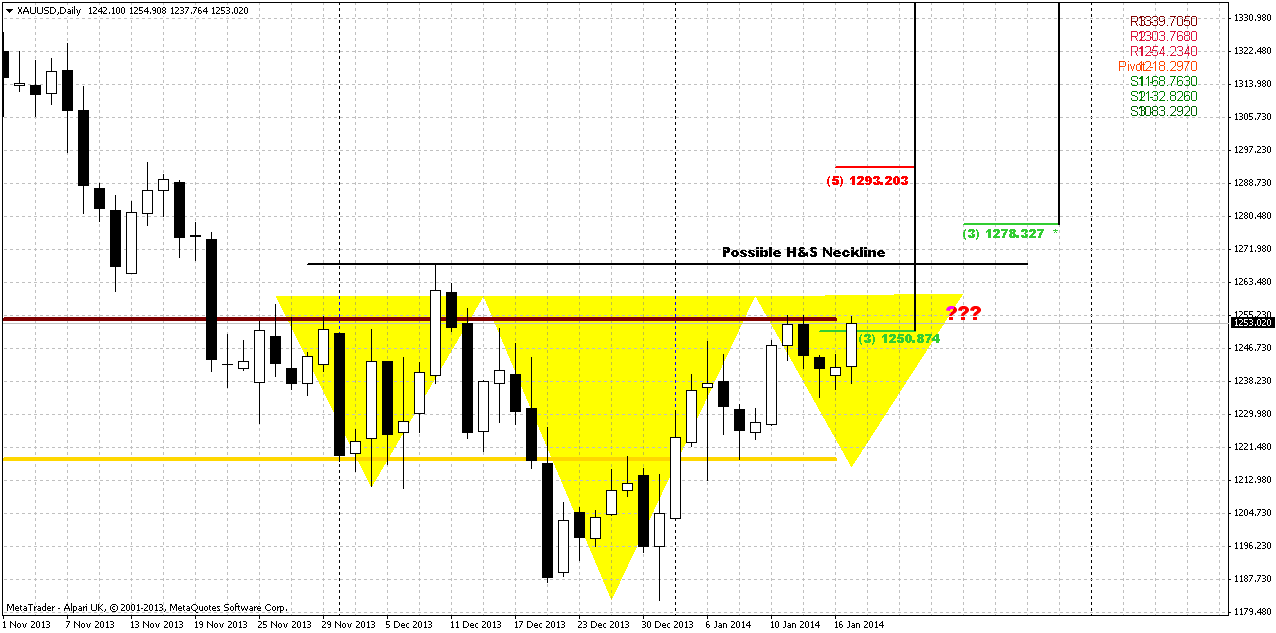
4-hour
Here market has passed through minor AB=CD 0.618 extension. Next target
stands right around WPR1 and daily K-resistance. We have some kind
daily Agreement at K-resistance. Market is not at overbought, so it has
chances to proceed slightly higher. Since daily resistance is rather
solid, some bounce should happen out from there and very probable that
it could become a starting point of right shoulder. If market will pass
through it as it does not exist we will have to review our opinion. 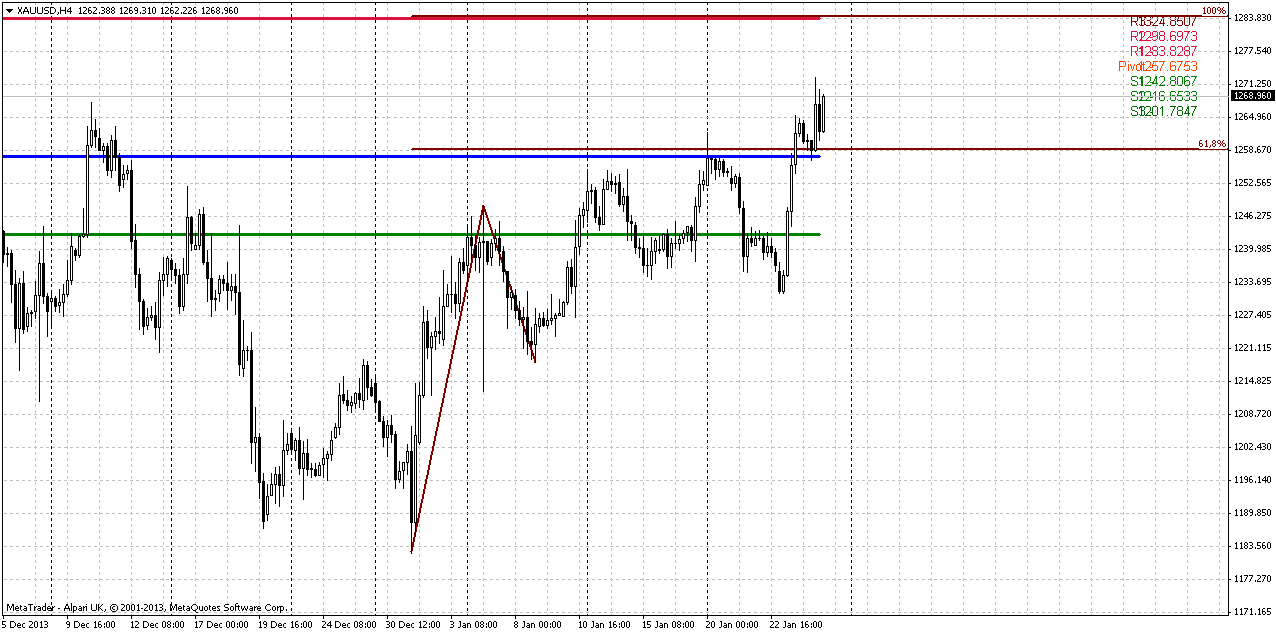
Market is still working on possible solid reversal pattern on daily chart. Thus, it looks like major events will follow a bit later. But right now we already can see interesting agreement between possible upward targets and Yearly Pivots in long term. At the same time there is some contradiction between recent fundamental data and technical picture. And soon probably it will be clear whether market really will show significant upward action or, this is just speculator’s game.
In shorter-term perspective market is approaching very strong resistance . Normally market should respect it by some meaningful retracement. From daily chart standpoint – all things stand the same – we wait bounce down for long entry, while in shorter-term situation the moment for searching possibility for scalp short trade should come somewhere around 1280 area.

The Gold Price & Trend Predictions blog made for gold traders to find good news and to provide the traders with daily price predictions and to learn how to trade the Forex Market for free.Just pure learning! It will be of great fun.You can judge by yourself the quality of information that I will be giving you in my blog.
Welcome to my blog where you can learn how to trade the Forex Market for free.The material is all created by myself and not copied from anywhere. There is a lot yet to come since there is a lot that you need to learn, and there is a lot that I need to share with you! So please just be patient – it will be worth it.You can judge by yourself the quality of information that I will be giving you . So just go now and start learning!
Below is a quick guide of how this website is structured, so you can find what you are looking for fast. Remember that I update the pages every day so either check back often.
In this section you will find quite a long article of what Forex is all about. If you are a beginner, this is a must read. It explains in detail what is required to start trading, what you should do and not, typical traps to avoid as a beginner and a lot of valuable information which you as a beginner must digest and learn prior opening any Forex account with real money.
In this section you will find your road map on how to become a real successful trader couple of months as from today.
In this section you will know the 3 major areas – Technical Analysis, Fundamental Analysis and Trading Physcology.
In this section you will find a gold mine of information about the technicalities of Forex. We will start from the very basics covering all the Forex jargon words which you will be hearing every day and we will be taking you up to the level required to finally learn to trade like a pro – technical analysis, also found in this section.
In this section you will see the tips that will help you stay away from crap forex products, which unfortunately the Forex market is invaded with.
This section has a very detailed article on how to avoid being scammed in this ruthless world of Forex. I will explain in detail six tips that you need to look for prior purchasing any products. Even though most of the time you may claim your money back,the time wasted is never returned. You should have used that time to learn how to trade! Read it!


YOU SHOULD NOT TAKE ANY MATERIAL posted on this BLOG AS RECOMMENDATIONS
TO BUY OR SELL GOLD OR ANY OTHER INVESTMENT VEHICLE LISTED.
TO BUY OR SELL GOLD OR ANY OTHER INVESTMENT VEHICLE LISTED.
Do your own due diligence.
No one knows tomorrow's price or circumstance.
I intend to portray my thoughts and ideas on the subject which may s be used as a tool for the reader.
I do not accept responsibility for being incorrect in my speculations on market trend.
I intend to portray my thoughts and ideas on the subject which may s be used as a tool for the reader.
I do not accept responsibility for being incorrect in my speculations on market trend.
King Regards